Financial information
Periodic Reporting
Find below the historical information, classified by year, related to our quarterly and half-yearly results: reports, presentations, results conference call, results call announcement, results in Excel format, results presentation video, Sustainability Reports and six-monthly consolidated accounts.
| 1Q26 | 2Q26 | 3Q26 | 4Q26 | |
| Release announcement and live acces to the presentation | ||||
| Report | ||||
| Excel Tables (Including historical data) | ||||
| Presentation | ||||
| Conference Call Recording | ||||
| Sustainability Report | ||||
| Consolidated Accounts* | ||||
| Individual Accounts* | ||||
| Consolidated Annual Financial Report** | ||||
| Individual Annual Financial Report** |
*The official document is the one prepared in the ESEF format.
**xHTML – ZIP: European Single Electronic Format (ESEF).
| 1Q25 | 2Q25 | 3Q25 | 4Q25 | |
| Release announcement and live acces to the presentation | ||||
| Report | ||||
| Excel Tables (Including historical data) | ||||
| Presentation | ||||
| Conference Call Recording | ||||
| Sustainability Report | ||||
| Consolidated Accounts* | ||||
| Individual Accounts* | ||||
| CbCR Report | ||||
| Consolidated Annual Financial Report** | ||||
| Individual Annual Financial Report** |
*The official document is the one prepared in the ESEF format.
**xHTML – ZIP: European Single Electronic Format (ESEF).
| 1Q24 | 2Q24 | 3Q24 | 4Q24 | |
| Release announcement and live acces to the presentation | ||||
| Report | ||||
| Excel Tables (Including historical data) | ||||
| Presentation | ||||
| Conference Call Recording | ||||
| Sustainability Report | ||||
| Consolidated Accounts* | ||||
| Individual Accounts* | ||||
| Consolidated Annual Financial Report** | ||||
| Individual Annual Financial Report** |
*The official document is the one prepared in the ESEF format.
**xHTML – ZIP: European Single Electronic Format (ESEF).
| 1Q23 | 2Q23 | 3Q23 | 4Q23 | |
| Release announcement and live acces to the presentation | ||||
| Report | ||||
| Excel Tables (Including historical data) | ||||
| Presentation | ||||
| Conference Call Recording | ||||
| Sustainability Report | ||||
| Consolidated Accounts* | ||||
| Individual Accounts* | ||||
| Consolidated Annual Financial Report** | ||||
| Individual Annual Financial Report** |
*The official document is the one prepared in the ESEF format.
**xHTML – ZIP: European Single Electronic Format (ESEF).
| 1Q22 | 2Q22 | 3Q22 | 4Q22 | |
| Release announcement and live acces to the presentation | ||||
| Report | ||||
| Excel Tables (Including historical data) | ||||
| Presentation | ||||
| Conference Call Recording | ||||
| Sustainability Report | ||||
| Consolidated Accounts* | ||||
| Individual Accounts* | ||||
| Consolidated Annual Financial Report** | ||||
| Individual Annual Financial Report** |
*The official document is the one prepared in the ESEF format.
**xHTML – ZIP: European Single Electronic Format (ESEF).
| 1Q21 | 2Q21 | 3Q21 | 4Q21 | |
| Release announcement and live acces to the presentation | ||||
| Report | ||||
| Excel Tables (Including historical data) | ||||
| Presentation | ||||
| Conference Call Recording | ||||
| Sustainability Report | ||||
| Consolidated Accounts* | ||||
| Individual Accounts* | ||||
| Consolidated Annual Financial Report** | ||||
| Individual Annual Financial Report** |
*The official document is the one prepared in the ESEF format.
**xHTML – ZIP: European Single Electronic Format (ESEF).
| 1Q20 | 2Q20 | 3Q20 | 4Q20 | |
| Announcement | ||||
| Report | ||||
| Excel Tables (Including historical data) | ||||
| Presentation | ||||
| Conference Audio Recording | ||||
| Video Summary | ||||
| Sustainability Report | ||||
| Consolidated Accounts PDF* | ||||
| Consolidated Annual Financial Report** | ||||
| Individual Annual Financial Report** |
*The official document is the one prepared in the ESEF format.
**xHTML – ZIP: European Single Electronic Format (ESEF).
| 1Q19 | 2Q19 | 3Q19 | 4Q19 | |
| Announcement | ||||
| Report | ||||
| Excel Tables (Including historical data) | ||||
| Presentation | ||||
| Conference Call | ||||
| Video Summary | ||||
| Sustainability Report | ||||
| Consolidated Accounts |
| 1Q18 | 2Q18 | 3Q18 | 4Q18 | |
| Announcement | ||||
| Report | ||||
| Excel Tables (Including historical data) | ||||
| Presentation | ||||
| Conference Call | ||||
| Video Summary | ||||
| Sustainability Report | ||||
| Consolidated Accounts |
| 1Q17 | 2Q17 | 3Q17 | 4Q17 | |
| Announcement | ||||
| Report | ||||
| Excel Tables (Including historical data) | ||||
| Presentation | ||||
| Conference Call | ||||
| Video Summary | ||||
| CSR Report | ||||
| Consolidated Accounts |
| 1Q16 | 2Q16 | 3Q16 | 4Q16 | |
| Announcement | ||||
| Report | ||||
| Excel Tables (Including historical data) | ||||
| Presentation | ||||
| Conference Call | ||||
| CSR Report | ||||
| Consolidated Accounts |
| 1Q15 | 2Q15 | 3Q15 | 4Q15 | |
| Announcement | ||||
| Report | ||||
| Excel Tables (Including historical data) | ||||
| Presentation | ||||
| Conference Call | ||||
| CSR Report | ||||
| Consolidated Accounts |
Key figures
ENCE’s key operating and financial indicators for the last 10 years:
- Pulp sales (t)
966.558
-0,1% - Group revenue (Mn €)
747,3
-14,7% - Net Profit (Mn €)
-54,5
n.s. - Cash Cost in the Pulp Business (€/t)
483
-2,1% - Group EBITDA (Mn €)
83,5
-49,3% - Group Net Debt (Mn €)
378
3,1% - Sale of renewable elec. generated from biomass (MWh)
1.241.050
+6,3% - Group EBIT (Mn €)
-36,9
n.s. - Biometano sales (MWh)
26.836
n.s.
- Pulp sales (t)
967.628
-1,1% - Group revenue (Mn €)
876,2
5,6% - Net Profit (Mn €)*
31,6
n.s. - Cash Cost in the Pulp Business (€/t)
493
-6,2% - Group EBITDA (Mn €)
164,5
85,2% - Earnings per share (€/acc.)
0,13
n.s. - Renewable Energy sales (MWh)
1.167.089
23,2% - Group EBIT (Mn €)
63,3
n.s. - Group Net Debt (Mn €)
321,2
14,8%
- Pulp sales (t)
978.501
18,4% - Group revenue (Mn €)
830,1
-17,27% - Net Profit (Mn €)*
-26,2
n.s. - Cash Cost in the Pulp Business (€/t)
526
-4,90% - Group EBITDA (Mn €)
89,3
-63,93% - Earnings per share (€/acc.)
-0,1
n.s. - Renewable Energy sales (MWh)
947.249
-36,10% - Group EBIT (Mn €)
-2
n.s. - Group Net Debt (Mn €)
279,6
n.s.
- Pulp sales (t)
826.617
-17% - Group revenue (€ Mn)
1.003,4
-22,4% - Net Profit (€ Mn)*
247,2
n.s. - Cash Cost in the Pulp Business (€/t)
553
41,0% - Group EBITDA (€ Mn)
247,6
-131,7% - Earnings per share (€/share)
1,02
n.s. - Renewable Energy sales (MWh)
1.481.446
3,6% - Group EBIT (€ Mn)*
278,2
n.s. - Group Net Debt (€ Mn)
-30
n.s
*Includes reversal of impairments and provisions related to the Pontevedra biofactory.
- Pulp sales (t)
996.058
-1,9% - Group revenue (€ Mn)
819,7
-15,8% - Net Profit (€ Mn)
-190,4
n.s. - Cash Cost in the Pulp Business (€/t)
392
+4,8% - Group EBITDA (€ Mn)
106,8
+45,1% - Earnings per share (€/share)
-0,78
n.s. - Renewable Energy sales (MWh)
1.430.199
+0,6% - Group EBIT (€ Mn)
-175,9
n.s. - Group Net Debt (€ Mn)
101,8
-42,8%
- Pulp sales (t)
1.015.482
+11,5% - Group revenue (€ Mn)
707,7
-3,8% - Net Profit (€ Mn)
-26,4
n.s. - Cash Cost in the Pulp Business (€/t)
374
-5,7% - Group EBITDA (€ Mn)
73,6
-42,0% - Earnings per share (€/share)
-0,11
n.s. - Renewable Energy sales (MWh)
1.421.446
+35,7% - Group EBIT (€ Mn)
-40,1
n.s. - Group Net Debt (€ Mn)
168,6
-67,12%
- Pulp sales (t)
910,499
-3.9% - Group revenue (€ Mn)
735.4
-11.6% - Net Profit (€ Mn)
9.2
-92.9% - Cash Cost in the Pulp Business (€/t)
397
5,2% - Group EBITDA (€ Mn)
127.0
-56.3% - Earnings per share (€/share)
0.04
-92.9% - Renewable Energy sales (MWh)
1,047,163
13.3% - Group EBIT (€ Mn)
32.5
-84.5% - Group Net Debt (€ Mn)
512.7
68.2%
- Pulp sales (t)
947.466
-2,9% - Group revenue (Millions €)
832,0
12,4% - Net Profit (Millions €)
129,1
40,7% - Cash Cost in the Pulp Business (€/t)
377
7,8% - Group EBITDA (Millions €)
290,9
34,7% - Earnings per share (€/share)
0,5
40,7% - Power sales (MWh)
923.935
4,5% - Group EBIT (Millions €)
209,6
40,1% - Net Debt (Millions €)
304,8
99,1%
- Pulp sales (t)
975.302
5,6% - Group revenue (Millions €)
740,3
22,3% - Net Profit (Millions €)
91,8
138,6% - Cash Cost in the Pulp Business (€/t)
350
-2,0% - Group EBITDA (Millions €)
216,0
72% - Earnings per share (€/share)
0,4
142,4% - Power sales (MWh)
884.149
40,7% - Group EBIT (Millions €)
149,6
105,8% - Net Debt (Millions €)
153,1
-29,9%
- Pulp sales (t)
923.408
4,3% - Group revenue (Millions €)
605,4
-8,8% - Net Profit (Millions €)
38,5
-22,8% - Cash Cost in the Pulp Business (€/t)
357
-0,6% - Group EBITDA (Millions €)
125,6
-34,5% - Earnings per share (€/share)
0,2
-24,1% - Power sales (MWh)
628.386
2,1% - Group EBIT (Millions €)
72,7
-45,4% - Net Debt (Millions €)
218,3
-9,5%
- Pulp sales (t)
885.280
-22,1% - Group revenue (Millions €)
663,9
-3,4% - Net Profit (Millions €)
49,9
135,4% - Cash Cost in the Pulp Business (€/t)
359
-11,6% - Group EBITDA (Millions €)
191,8
337,9% - Earnings per share (€/share)
0,2
-63,8% - Power sales (MWh)
615.397
35,7% - Group EBIT (Millions €)
133,2
324,6% - Net Debt (Millions €)
241,2
-15,2%
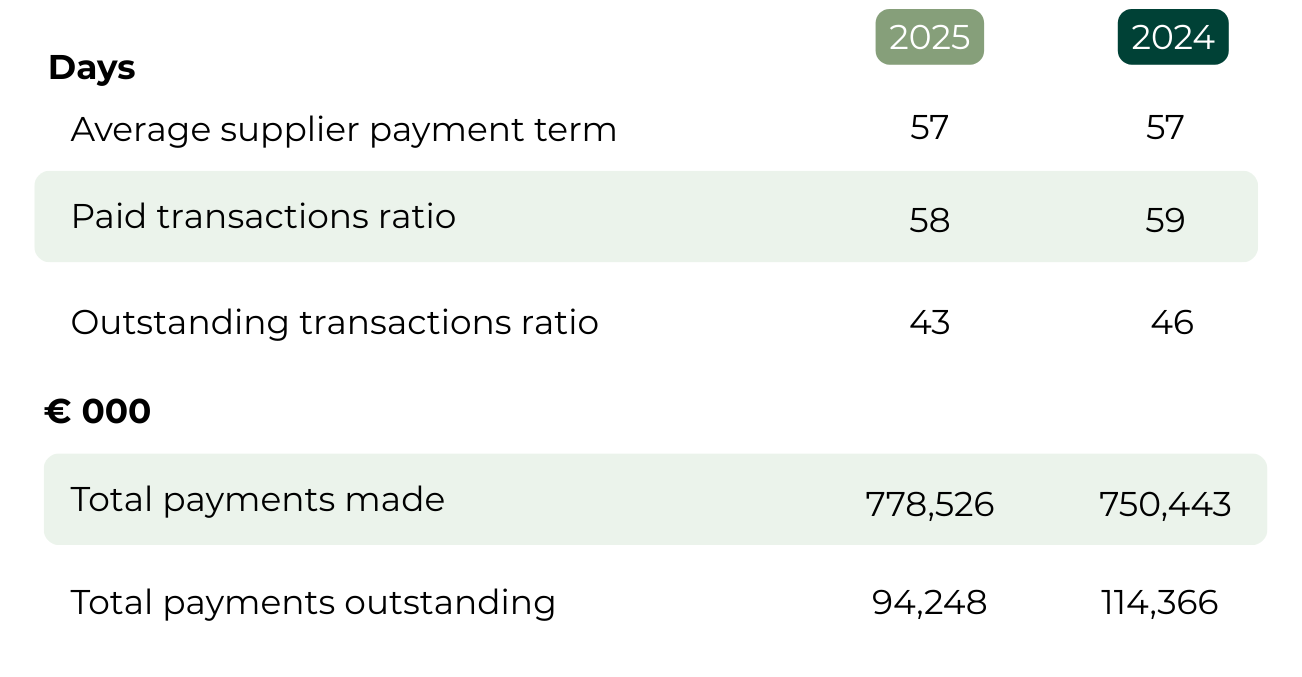
Average supplier payment term
The average payment term disclosures were prepared in accordance with Law 15/2010, on combating late payment in commercial transactions, the amendments introduced via Law 18/2022, on business creation and growth and final provision two of Law 31/2014, as well as the related Resolution issued by the Spanish Audit and Accounting Institute (ICAC) on 29 January 2016.
The average payment term:
Below are the disclosures regarding the invoices paid within the legally stipulated deadline:
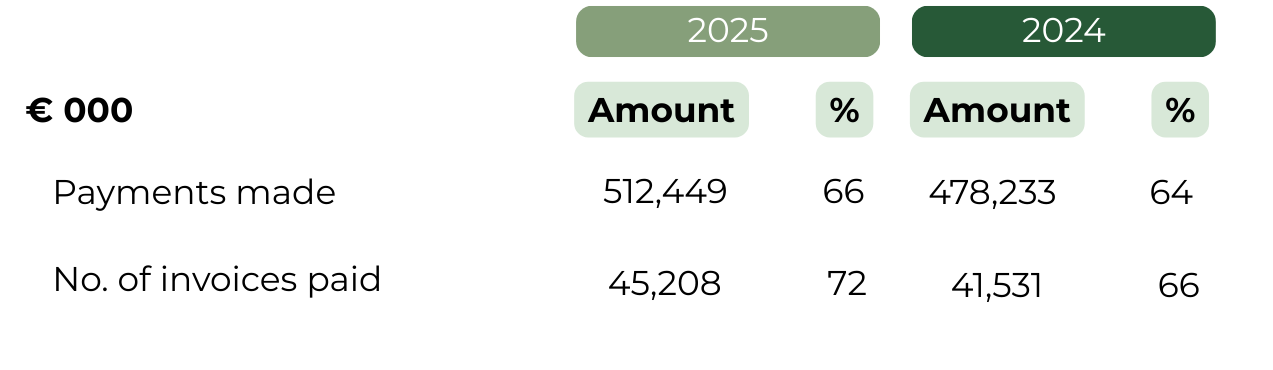
That criteria underpinning the preparation of those disclosures are as follows:
“Average period of payment to suppliers” is understood as the period that elapses from the delivery of the goods or the provision of the services by the supplier to payment for the transaction. That term is calculated by dividing the sum of the paid transactions ratio times total payments made plus the outstanding transactions ratio times total payments outstanding by the sum of total payments made and total payments outstanding.
Paid transactions ratio: the number of days resulting from dividing the sum of the products of the amounts paid in each transaction by the number of days of payment and the total amount paid during the year.
Outstanding transactions ratio: the number of days resulting from dividing the sum of the products of the amounts of transactions outstanding by the number of days by which they are outstanding and the total amount outstanding.
The figures exclude payment obligations that have been withheld, balances with public entities and standing orders.
The disclosures relate to the Spanish companies consolidated after eliminating accounts payable and receivable between those subsidiaries.